5 Business Driving Metrics for Digital Marketing
In this Digital Marketing era, not only the measurable metrics and other analytical data are possible and available in real-time, the need to measure these data is considered paramount as evidence of success. In a rapidly changing business landscape, the need to measure digital marketing success has increased in importance more than ever. Businesses take maximum advantage of digital channels such as Google search, social media, email, and their websites to connect with their current and prospective customers.
Today, in the digital marketing world, numbers are the key points around which everything rotates.
You must know the worth of your time that you’re spending on writing those erudite Facebook posts.
Check the number of reactions, comments and shares that you are getting and see how many “Fans” and their friends you are reaching. If your followers are loving your tweets on Twitter, check the number of re-tweets you are getting.
I want you to focus on five numbers, 5 digital marketing metrics that will drive your business.
Key Metric #1- Page Behavior on Google Analytics:
Google Analytics is a powerful tool for brands, bloggers or businesses. Through the use of Google Analytics, you can uncover a tremendous amount of data about your website that can be used to enhance your digital marketing, also in business development strategies.
The problem is there are literally thousands of numbers to look at.
You can check the full website traffic as a whole or any single individual page by checking the single screen of Google Analytics.

When you click on ‘All Pages’ option, you’ll see all the websites and you can get there by entering Google Analytics, by selecting the ‘Reporting’ tab and then scroll down, simply click on ‘Behavior’. Once there click on “Site Content” and then “All Pages”. This is the page behavior in Google Analytics under digital marketing.
Look at the wealth of information!
From there, you can see the top performing pages on top-ranked by ‘Pageviews’. Also, you can make decisions about what’s working, what’s not and what our community wants more (or less!).
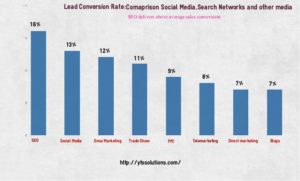
Looking at the traffic channels you will get to see which channel is the largest driver of traffic to your site. You’ll notice that the channels are listed in order of driving power; the channel at the top is the one that drives the majority of site traffic.
Key Metric #2 – E-Mail Open Rates:
What’s the point in spending all the time and effort in building an email list if the people on the list never open the emails that you sent them?
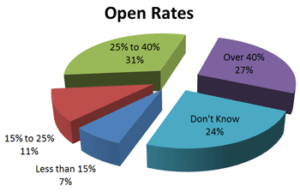
Email open rate is a critical metric with which you should get intimately familiar. But, according to me, at first, you must know that what’s a good email open rate under digital marketing.
It’s a question much pondered about, as it depends on the condition and some other metrics.
Your email open rate is calculated by dividing the number of unique opens by the number of emails sent, minus the number of bounces:
Open Rate = Unique Opens / (Number of Emails Sent – Bounces)
So, out of the people who actually received your email, your open rate is the percentage of people who opened that email.
Across all industries, the average open rate for the second quarter of 2016 was 25%.
However, the more accurate answer really depends on your industry. For example, MailChimp reports that the average open rate for companies in hobby industries is 28.49%, whereas the average open rate in the digital marketing industry is 17.85%. That’s a pretty significant difference.
So, if you really want to have a benchmark to measure against, you should be looking at the average open rates for your particular industry.
The massive fluctuation is based on the segment of our entire subscriber base we choose for the mailing and the subject.
You need to become familiar enough with your email open rate to understand what a good/bad open rate is based on your business, your market and the type of emails you are sending to the different segments of your list, which is necessary to understand the digital marketing better.
Key Metric #3 – Facebook Post Engagement:
Facebook post engagement really depends on Facebook fan page numbers.
It doesn’t really consider the number of fans you’re having on your Facebook account, what really matters is the number of people engaging, reacting, commenting and sharing your posts.
When calculating Engagement Rate for Competitors, you don’t have access to their Facebook Insights data, but can still draw meaningful insights by looking at engagement relative to total fans. This method of calculating Engagement Rate can also be used to measure page Engagement Rate for your competitors since it does not require page insights data.
This calculation for Engagement Rate can also be referred to as Engagement percent of total fans. To draw meaningful conclusions, make sure that while comparing competitor engagement rates, you should use this calculation for your kind of digital marketing as well.

As a rough comparison, the number of Facebook Fans you have is similar to the size of your email list. The number or percentage of post engagements is similar to your email open rate and link clicks.
Key Metric #4 – Landing Page Conversion Rate:
What you think, what does it really mean by a good landing page? A good landing page really means ‘High Converting’.
We have an absolute scale to measure our landing pages performance.
If our landing page conversions rate (the number of people who complete the information divided by the number of people who land on the page) is under 30% we pull the page, work on it and try again.
From 30% to 50% is considered “average” for us and, we leave the page up while we continue working on it. Above 50% is considered “good” and we pore a disproportionate percentage of our Facebook Ads budget to promote it.
But, the point is how do you calculate your landing page conversion rates.
The landing page conversion rate is simply the “Results” (the number of people who made it to the “Thank You” page) divided by the “Link Clicks” (the number of people who clicked the actual ad and were taken to the landing page).
Key Metric #5 – Blog Social Sharing:
When it comes to promoting your blog post, I recommend you doing everything in your power to do so. Share it, tweet it, promote it, like it, talk about it, comment on it, and put it on every social network where ever you possibly can.
How many people share our blog posts, and where, tells us the relative value of the information we are providing to the online community, whether or not it can be profitable for them.

By using alternative forms of content promotion, you can gain a huge advantage over the competition. Instead of trying to gain clicks, views, conversions, and engagements from a narrow slice of the population, you’re able to maximize the huge amount of traffic from new sources.
I want to share the techniques that let you share your content easily through digital marketing. These are:
- You should start with the right content, with the primary goal of producing a blog article isn’t to “rank” as much as possible but it is to create a well-written piece of content.
- Write content for your target persona, which includes a few demographic facts and figures along with a fictional name and photo of the person you’re trying to reach.
- You should know about your topic clearly.
- Use long-tail keywords because they will drive targeted traffic to your site.
The above presented 5 metrics can be easily used to get high traffic at a glance, how our website, email, Facebook, landing pages and blogs are performing.
Don’t be afraid of the numbers, just embrace them. They provide amazing insights that will drive your entire digital marketing.
If you found the post useful, I’d be very grateful to get your thoughts in the comment box below.